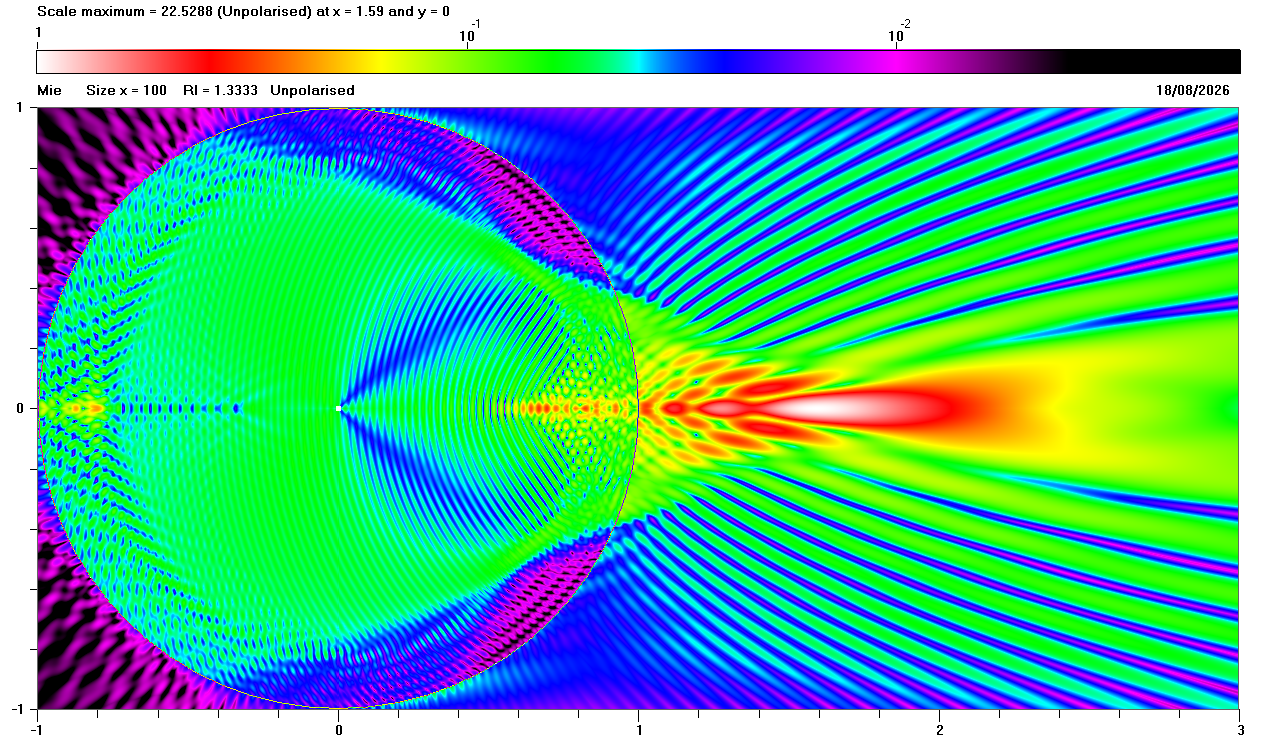
Fig. 1(a) Mie theory calculations for unpolarised light
| Previous page: Detailed analysis of resonant scattering |
Most of this web site is concerned with "far-field" scattering that occurs when a spherical particle is illuminated by monochromatic light or by wide spectrum of light (e.g. sunlight).
This page examines:
All of the following diagrams show results for size parameter x = 2 π a / λ = 100 (where a is the radius of the particle and λ is the wavelength of the light) and refractive index n = 1.3333. Assuming red light with λ = 0.65 μm = 650 nm, this implies that the particle would have radius a ≈ 10.35 μm.
The circle in each diagram represents the spherical particle: the centre of the particle is at x0 = 0 and y0 = 0 with radius r = 1. The intensity of the field is represented by the false colour scale shown above each diagram: this scale is normalised to the maximum field in each diagram.
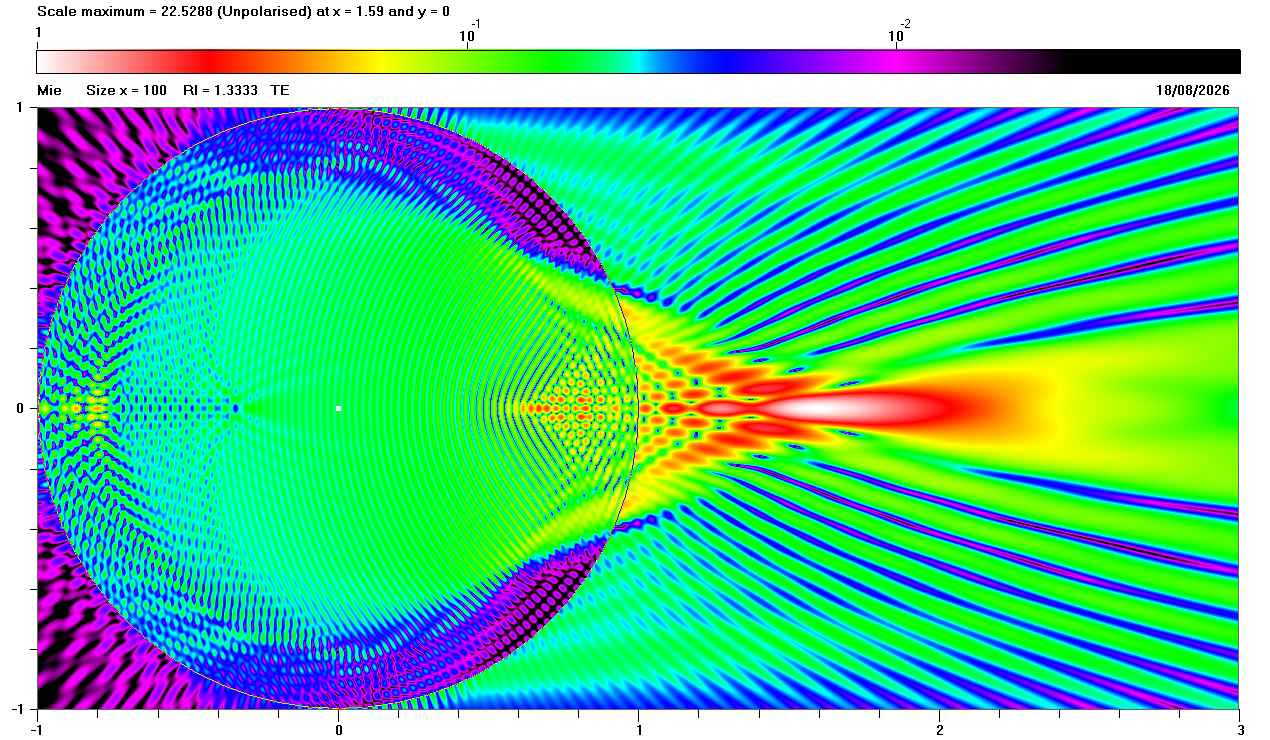
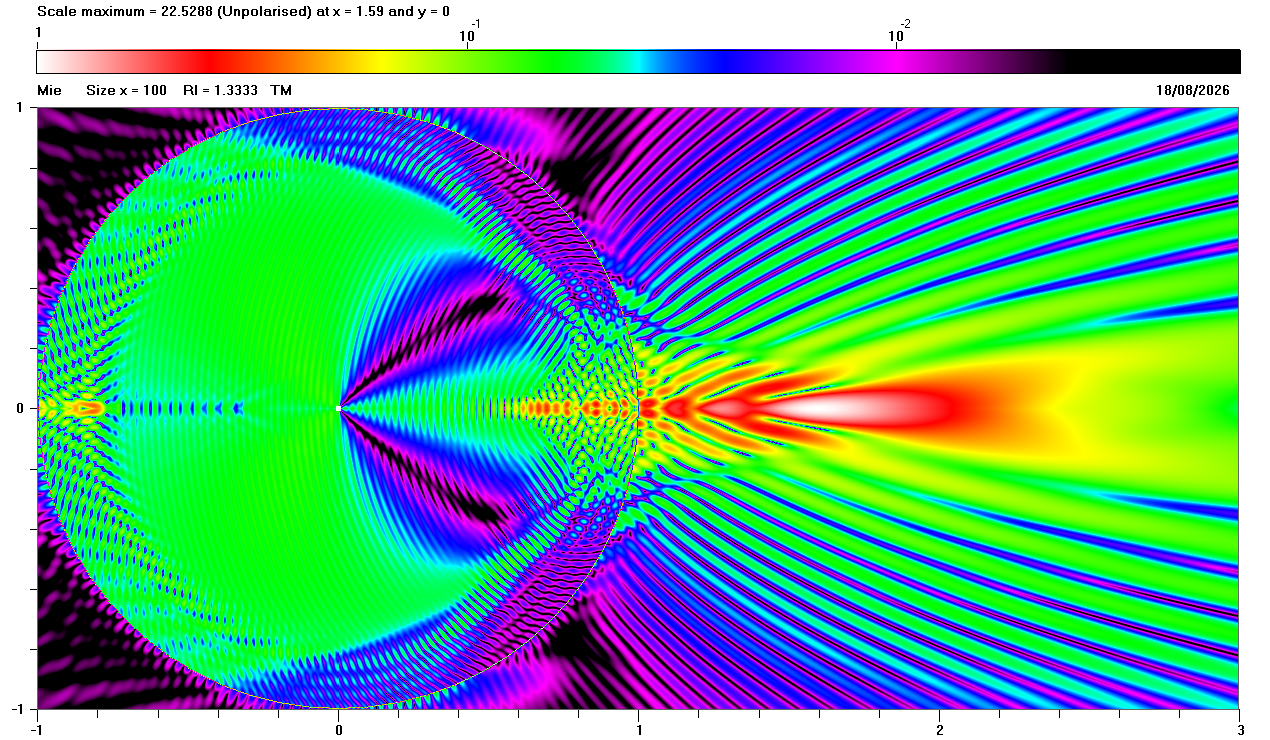
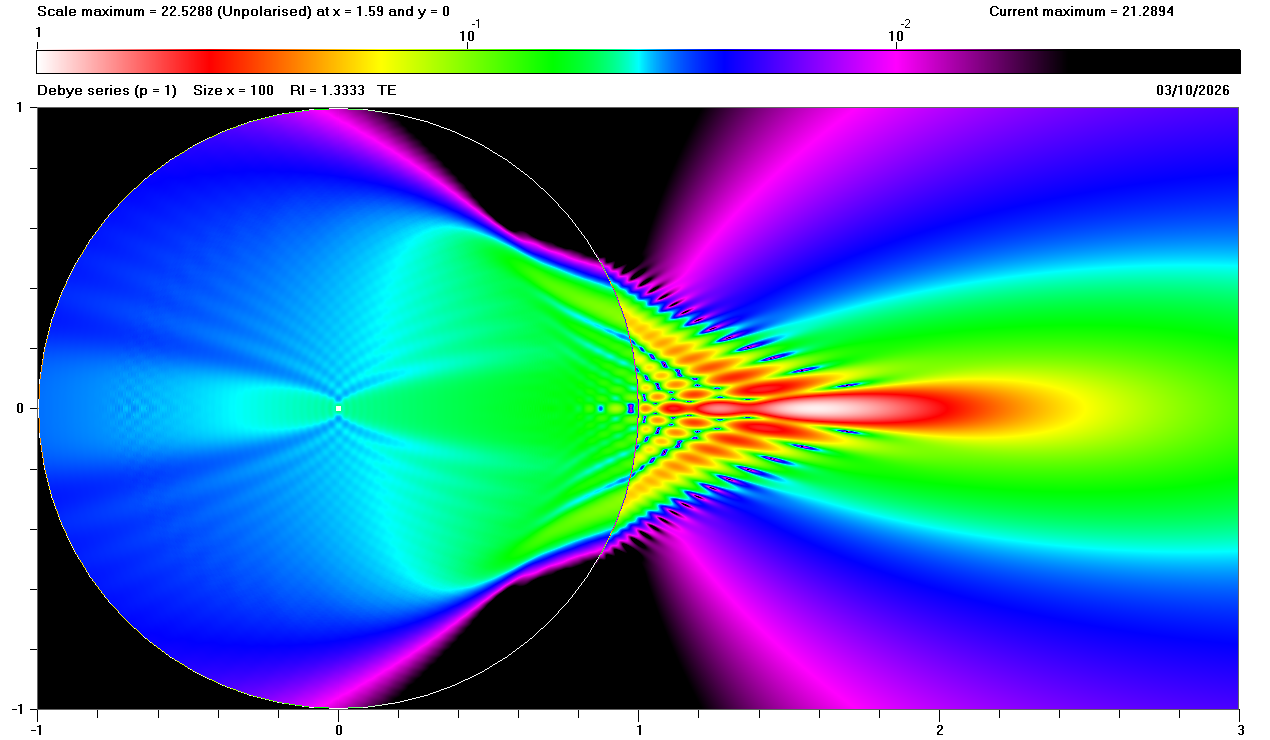
Fig. 1(a) shows some very complicated patterns, especially inside the particle. It is particularly interesting to see that the maximum intensity in Fig. 1(a) occurs outside the spherical particle at x = 1.62 and y = 0. Figs. 1(b) and 1(c) below demonstrate that the patterns are very dependent on polarisation.
Mie theory does not provide any explanation for the features of internal fields and near-fields but, as detailed elsewhere on this web site, the Debye series is a rigorous calculation method that can identify light that has been subjected to a specified number of external or internal reflections, such as:
More generally, when p > 1, the light is subject to (p - 1) internal reflections.
The animation in Fig. 2 below shows the cumulative sum of the Debye series calculation from p = 0 through p = 8 scattering, finishing with the full Mie calculation.
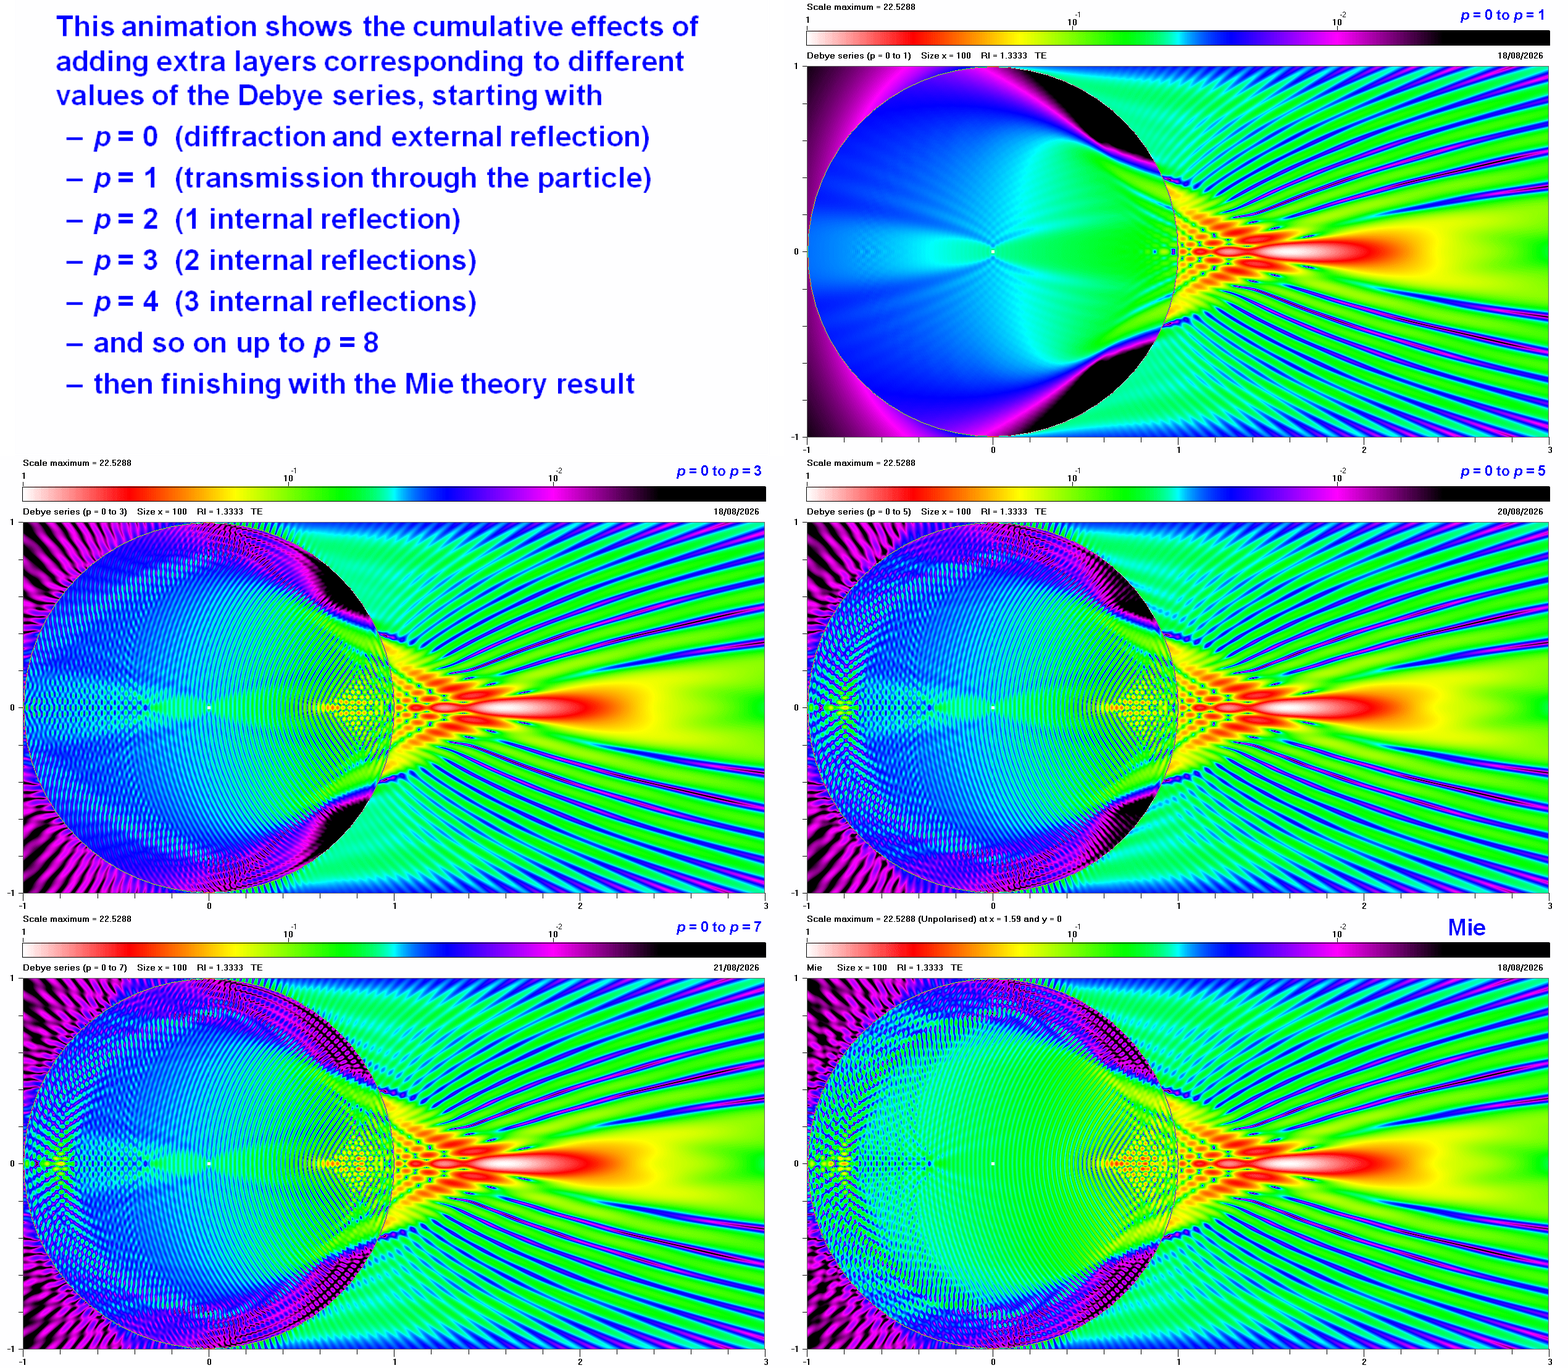
The "empty" circle in Fig. 2 when p = 0 demonstrates that no light enters the sphere because all of the incident light is either diffracted or reflected from the exterior of the sphere. Note that the external field to the right of the sphere (i.e. forward scattering) hardly changes in Fig. 2 after showing the sum of p = 0 and p = 1 scattering. Fig. 3 below confirms that the maximum at x = 1.62 and y = 0 is predominantly due to p = 1 scattering, corresponding to direct transmission through the sphere with no internal reflections.
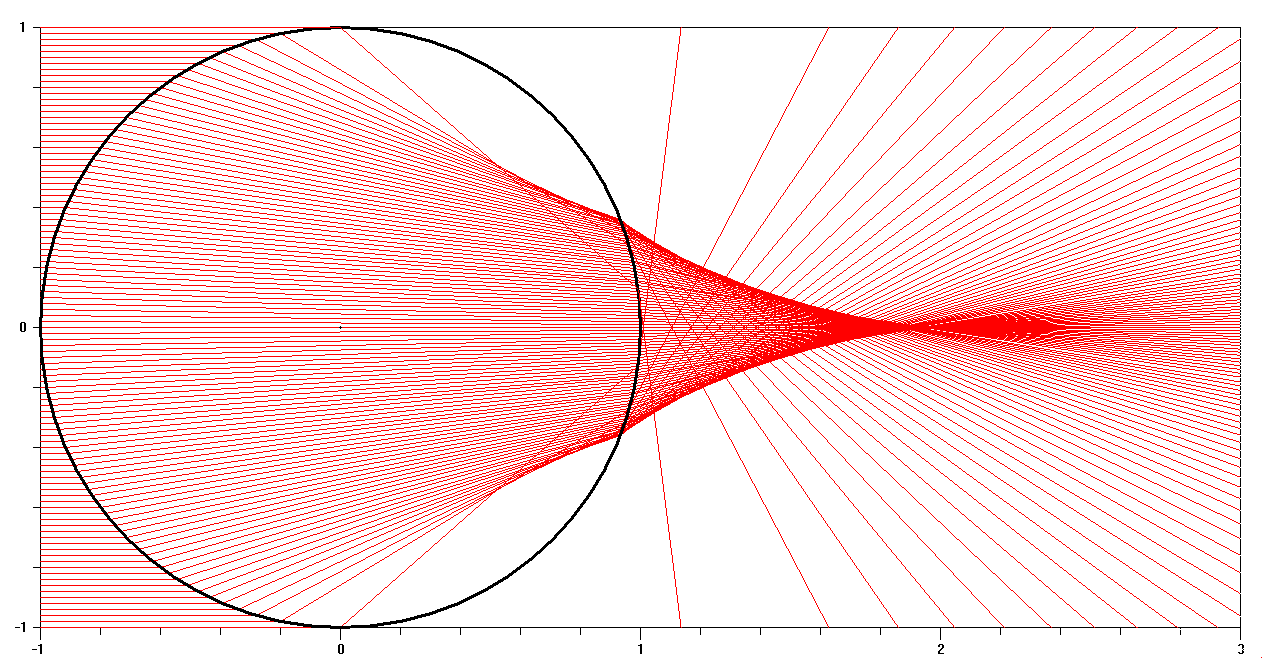
It is often helpful to examine ray paths calculated using geometrical optics, as shown below in Fig. 4 for p = 1, where the parallel incident rays on the left of the sphere are tracked as they pass through the sphere. This suggests that the convergence of p = 1 rays to the right of the sphere is responsible for the maxima seen in Figs. 1 and 2 above. Note, however, there is a discrepancy in that the maxima in Figs. 1 and 2 occur at x = 1.62 and y = 0, whereas ray tracing shows a maximum at x ≈ 1.9 and y = 0. This anomaly is due to the fact that geometrical optics is not really applicable to scattering of visible light by very small spheres (e.g. radius a ≈ 10 μm as assumed in Figs. 1 and 2). In practice, Debye series calculations demonstrate that the location of the p = 1 maxima is a function of the size parameter of the sphere, as shown here.
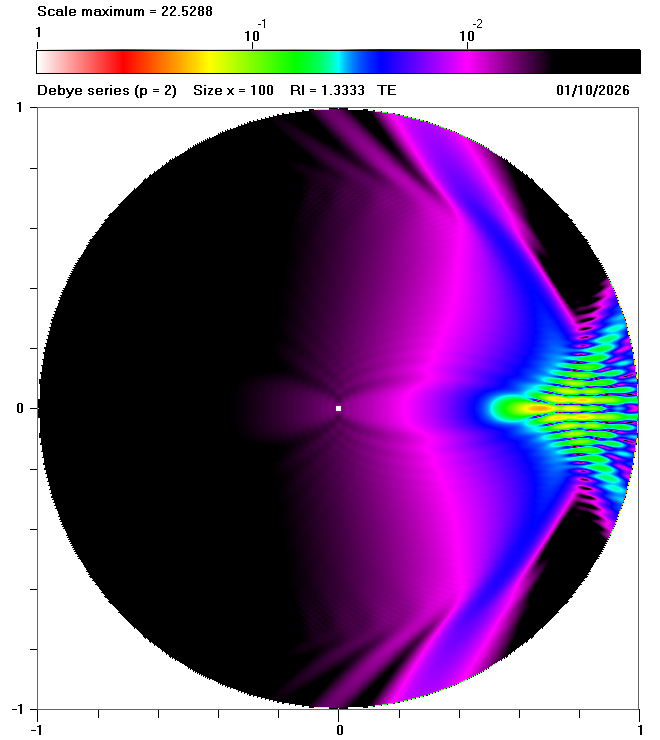
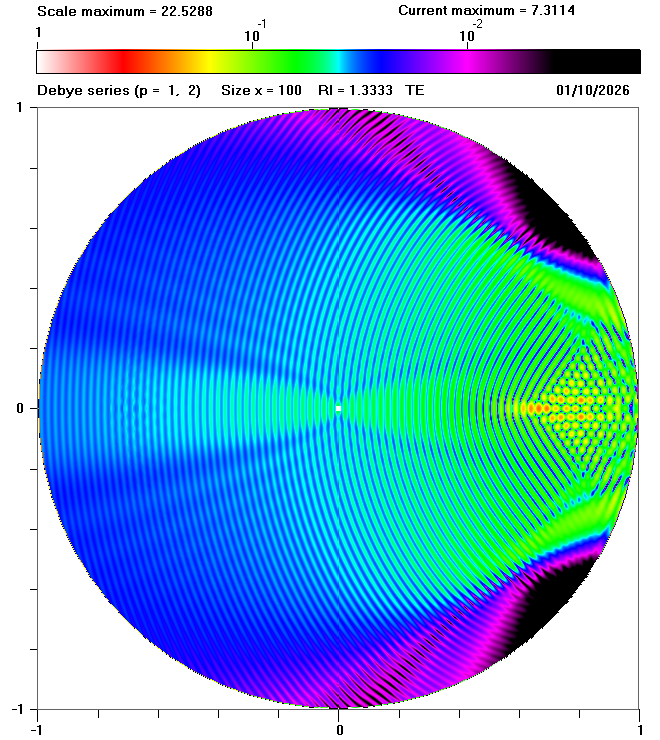
Having identified the reason for the forward scattering maxima, we can now turn our attention to the internal field. The animation in Fig. 2 shows that the internal field contains many interesting features, such as the series of fine maxima and minima that appears in the sum of p = 0, p = 1 and p = 2 scattering as shown in Fig. 5 below:
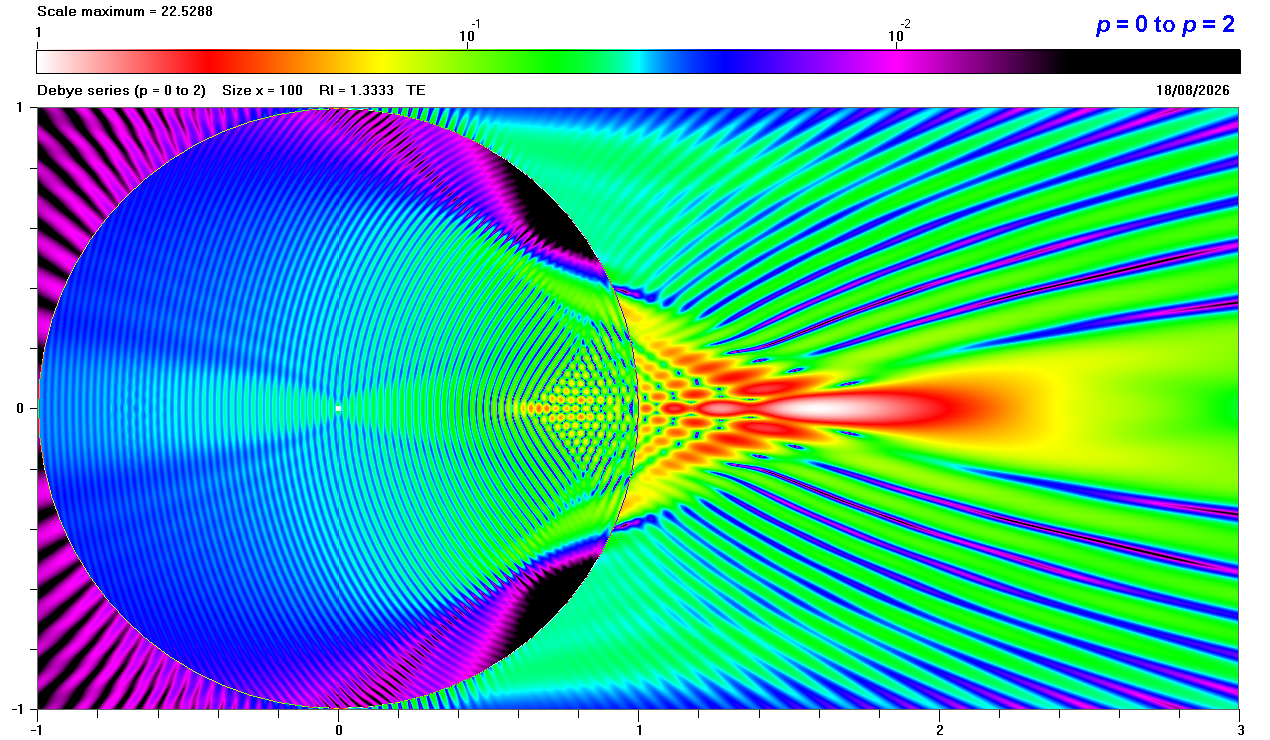
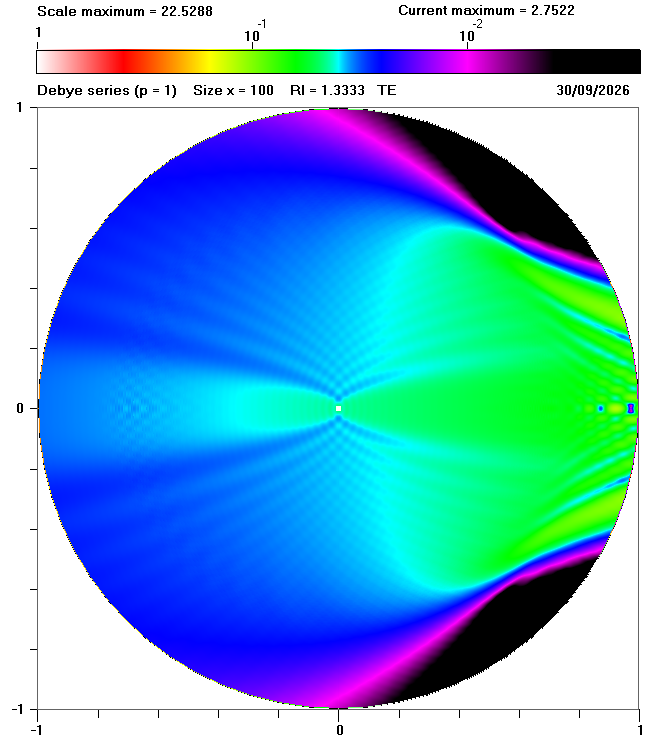
As we already know that p = 0 scattering does not contribute to the internal field, these maxima and minima must be the result of interference between p = 1 and p = 2 scattering. Figs. 6(a)-(c) below show the individual contributions to the internal field caused by p = 1 and p = 2 scattering and their combined effect. Fig. 6 confirms that the dominant fine pattern seen in Fig. 6(c) is due to interference between p = 1 and p = 2 scattering.
 |
 |
 |
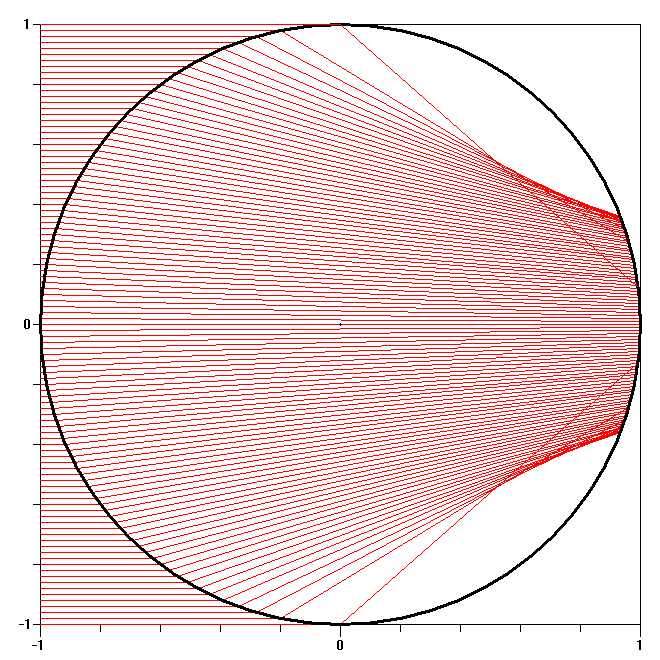
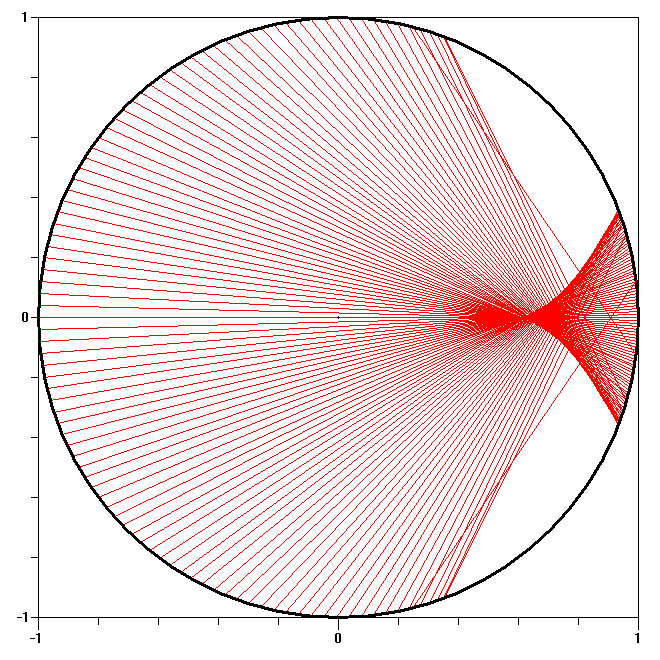
It is interesting to explore the mechanism behind this interference pattern using ray tracing, as in Fig. 7 below.
 |
 |
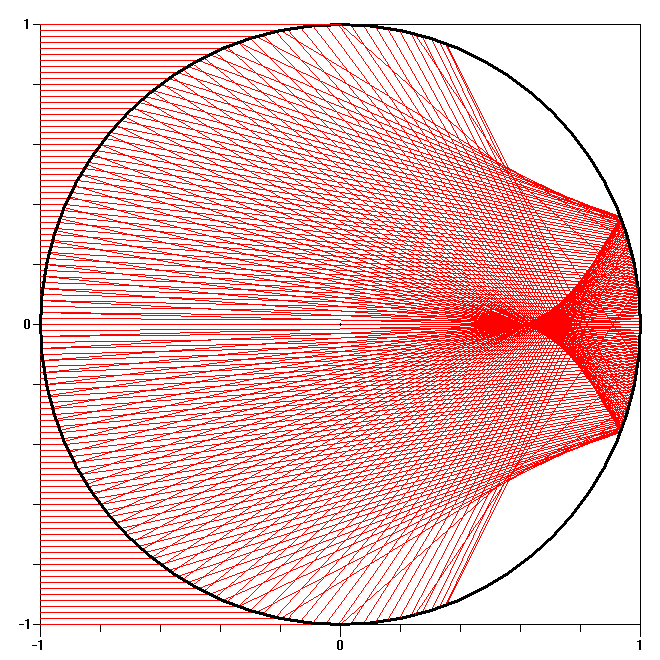 |
The areas where the p = 1 and p = 2 rays overlap in Fig. 7(c) are similar to the areas where the interference patterns occur in Fig. 6(c). Unfortunately, ray tracing diagrams such as those shown in Fig. 7 contain no direct information about the intensity of the internal field for a specified value of p. Having identified the fine patterns in Fig. 6(c) as interference patterns, the next step is to adapt ray tracing calculations so as to generate diagrams showing the internal fields, similar to those shown above for Mie and Debye series calculations. To achieve this goal, we need to calculate the amplitudes and phases of the p = 1 and p = 2 contributions at specific points in the sphere.
| Previous page: Detailed analysis of resonant scattering |